
What is PCR?
Background health information. Main sections are listed under “On this page”.
For testing availability, samples, or results, see Services or contact the laboratory.
What is PCR?
The polymerase chain reaction (PCR) was originally developed in 1983 by the American biochemist Kary Mullis.
He was awarded the Nobel Prize in Chemistry in 1993 for his pioneering work
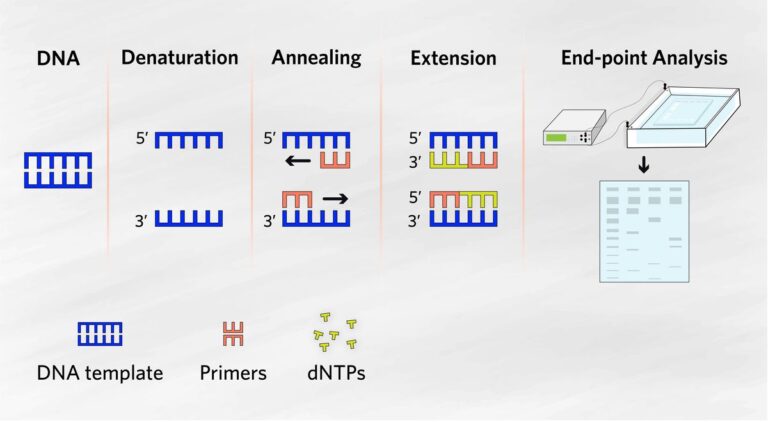
- DNA template, primers, and nucleotides
- End-point analysis
PCR is used in molecular biology to make many copies of (amplify) small sections of DNA or a gene. Using PCR, it can to generate thousands to millions of copies of a particular section of DNA from a very small amount of DNA.
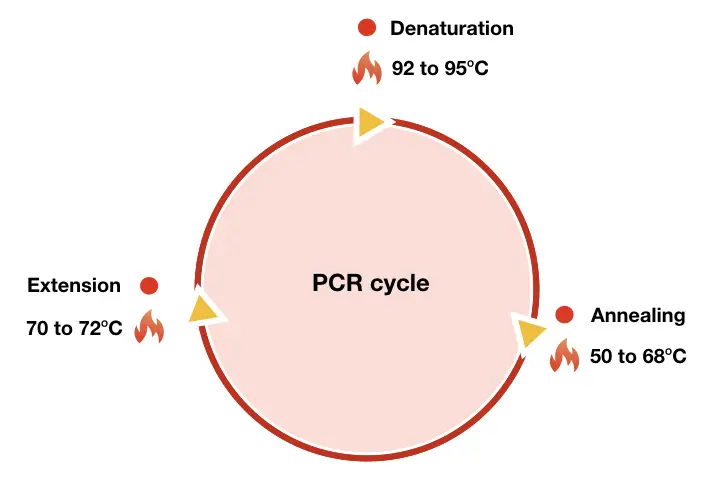
- Denaturation: 92–95°C
- Annealing: 50–68°C
- Extension: 70–72°C
- The values vary by assay.
The general concept of PCR, which includes primers, DNA polymerase, nucleotides, specific ions and DNA template, consists of cycles that comprise steps of DNA denaturation, primer annealing, and extension.
The invention of PCR has greatly boosted research in various areas of biology and this technology has significantly contributed to the current level of human knowledge in many spheres of research.
PRINCIPLE
Two common methods for the detection of PCR products in real-time PCR are:
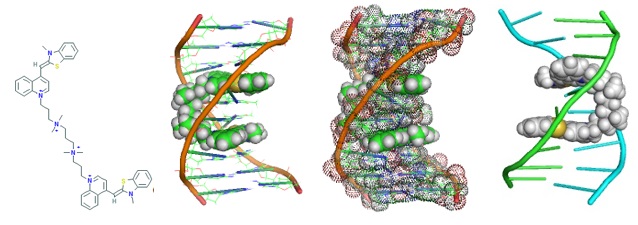
a) Non-specific fluorescent dyes that intercalate with any double-stranded DNA
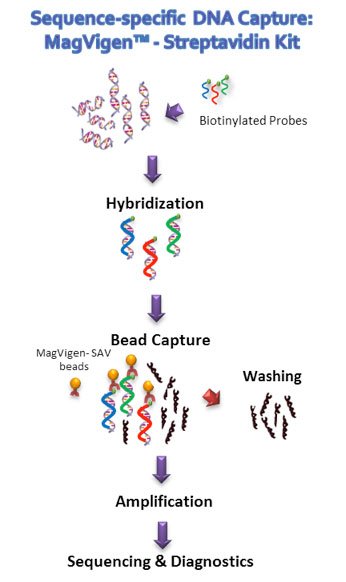
- Biotinylated probes
- Bead capture
- Washing
- Sequencing and diagnostics
b) Sequence-specific DNA probes consisting of oligonucleotides that are labelled with a fluorescent reporter, which permits detection only after hybridization of the probe with its complementary sequence.
USAGE
Real-time PCR has been extensively used for gene expressions studies. The PCR efficiency is a significant factor for the quantification of the target DNA in unknown samples.
Since PCR can amplify a specific fragment of DNA, it has been used in pathogen diagnostics. With the increasing amount of sequencing data available, it is literally possible to design qPCR (quantitative PCR) assays for every microorganism of interest. The essays are used typing of strains and isolates, antimicrobial resistance profiling, toxin production, etc.
PCR service claims
The source graphic uses cost, speed, and time symbols. It does not provide enough context for a service claim.
The lower time of amplification is facilitated by the simultaneous amplification and visualization of newly formed DNA amplicons. Moreover, this method is safer in terms of avoiding cross contaminations because no further manipulation with samples is required after the amplification.
The essays are used typing of strains and isolates, antimicrobial resistance profiling, toxin production, etc.
Unlabeled percentage graphic
The source image shows 90% and 70% without a measure, source, or population. The values require review.
The detection of important clinical and veterinary viruses using culture methods is time-consuming or impossible, while ELISA tests are not universally available and suffer from comparatively low sensitivity and specificity.
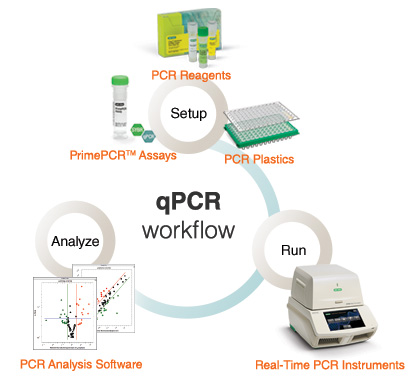
- Set up the assay and reagents
- Run the real-time PCR instrument
- Analyze the PCR data
Real-time quantitative PCR provides the appropriate sensitivity and specificity. Moreover, determination of the viral load by (RT)-qPCR is used as an indicator of the response to antiviral therapies.
Instrumentation
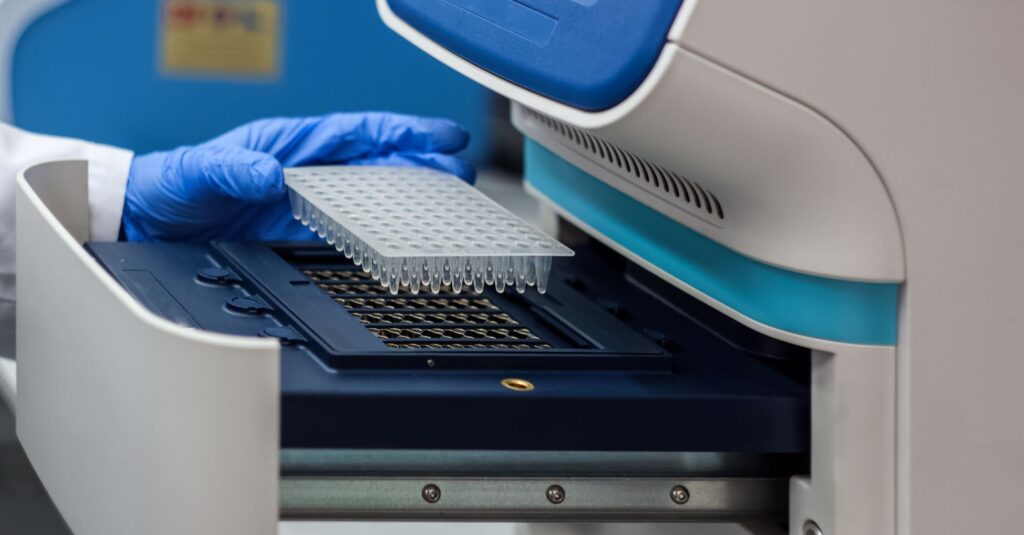
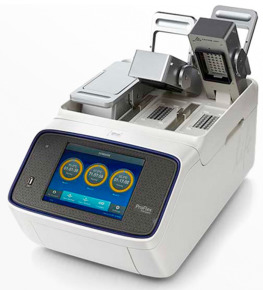
Thermal cyclers with integrated fluorimeters and some arrangement for transferring excitation light from a source into the reaction vessel and then from the sample to a detector are required for real-time PCR. The heating blocks that are the mainstay of the standard PCR instrument market present several technical challenges in conversion to application in real-time machines.
Data Analysis
Real-Time PCR Data analysis software provided with real-time PCR instruments allows three principal types of data analysis.
- Measurement of the cycle number at which any increase in the fluorescence within each reaction vessel reaches significance
- The data are used in conuction with the results from external standards to estimate the original number of template copies
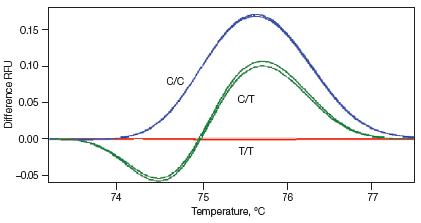
- Difference in RFU
- Temperature in °C
- Curves labeled C/C, C/T, and T/T
- Melting curves are transformed to provide plots of -dF/dT against T (F = fluorescence and T = temperature) in which a peak (melting peak) occurs at the equilibrium temperature for each duplex.
In general, the different software is easy to use and allows rapid and reproducible data analysis.
Specificity
This parameter in Real Time PCR refers to the specificity of primers for target of interest. Analytical specificity consists of two concepts: inclusivity describes the ability of the method to detect a wide range of targets with defined relatedness. Exclusivity describes the ability of the method to distinguish the target from similar but genetically distinct non-targets.
Sensitivity
In Real Time PCR, it also known as Limit of Detection (LOD), as the lowest amount of analyte, which can be detected with more than a stated percentage of confidence, not necessarily quantified as an exact value. The lowest concentration level that can be determined as statistically different from a blank at a specified level of confidence.
PCR and antibody-test graphic
The source image combines PCR text with IgG and IgM strip labels. A qualified reviewer must clarify the test types.
For limited concentrations of analyte (nucleic acids), the output of the reaction can be a success (amplification), or a failure (no amplification at all), without any blank, or critical level at which it is possible to set a cut-off value over which the sample can be considered as positive one.
Moreover, it should be remembered here that, by definition, a blank sample should never be positive in PCR
POPULARITY OF REAL TIME PCR
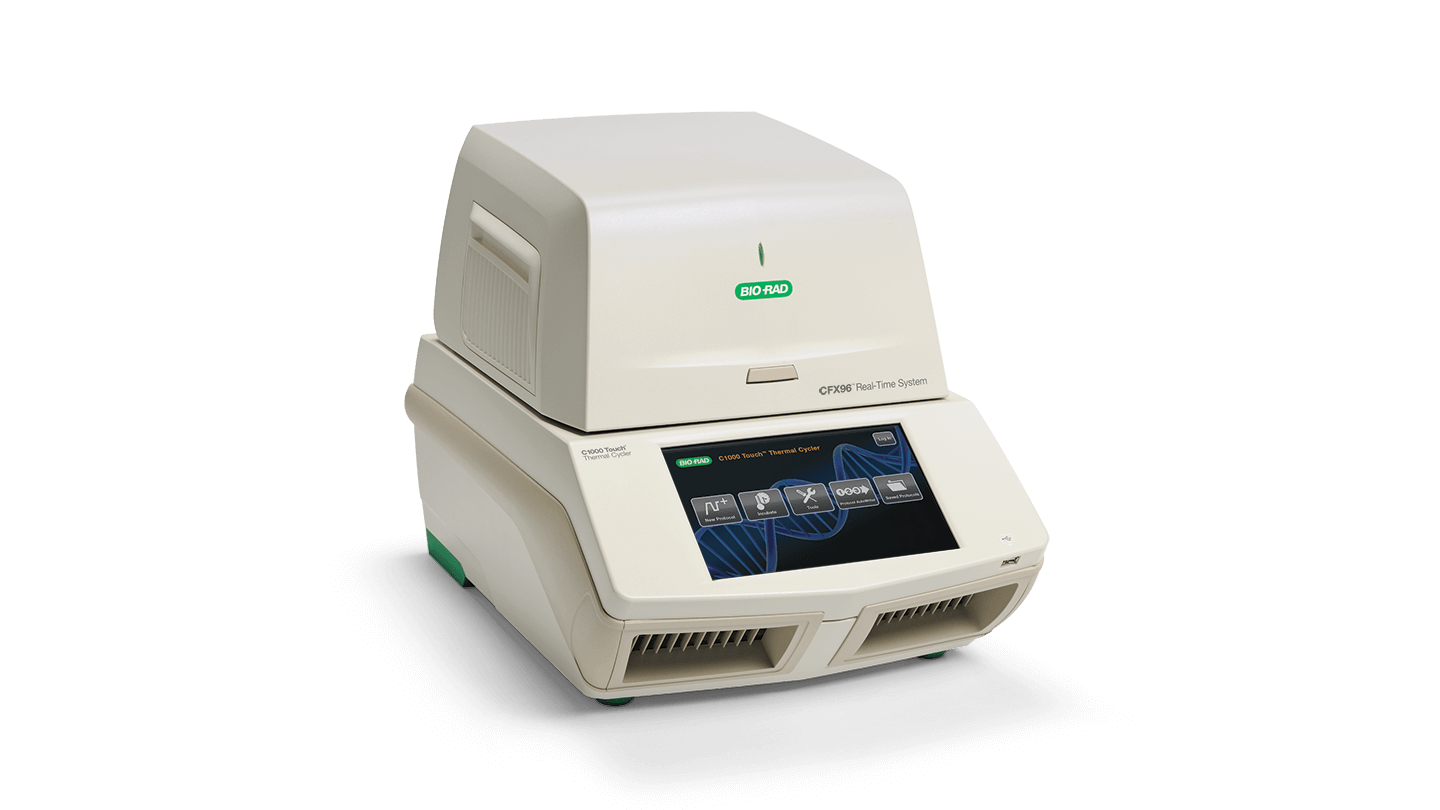
In a relatively short time since their first introduction in the mid-1990s, real-time PCR machines have become widely available to biologists. This has led to an explosion in the number of publications describing applications of the method.
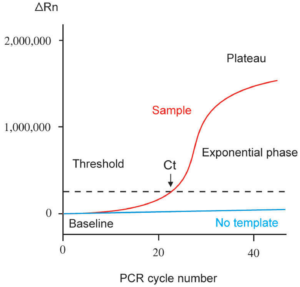
- PCR cycle number
- Change in normalized fluorescence
- Baseline
- Threshold
- Ct
- Exponential phase
- Plateau
Indeed, a graph of number of papers against time resembles a real-time PCR plot. Most of the main application that exploit real-time PCR previously relied on standard PCR and the main fields included diagnostic microbiology and human genetic analysis. However, the decreased hands-on time, increased reliability and improved quantitative accuracy of real-time PCR methods are contributing to a widening of their use into areas that were not previously dominated by PCR.
CONCLUSION
Real Time PCR technology represents a powerful tool in microbial diagnostics. In viral and parasitical detection, quantification and typing, the suitability of this technique is beyond doubt; in bacterial diagnostics, it can replace culture techniques, especially when rapid and sensitive diagnostic assays are required.
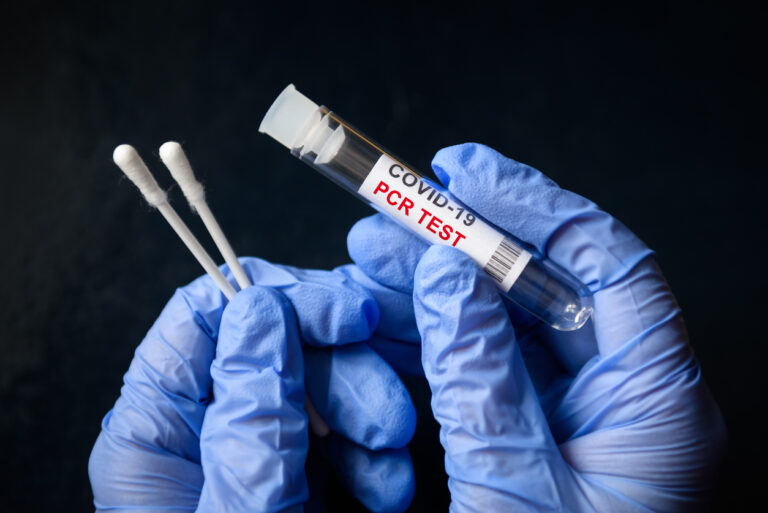
The spread of PCR to different areas of routine microbial diagnostics together with the lack of standard procedures for the determination of basic functional parameters of PCR has led to a scenario in which standardization of methods is performed according to different rules by different laboratories.
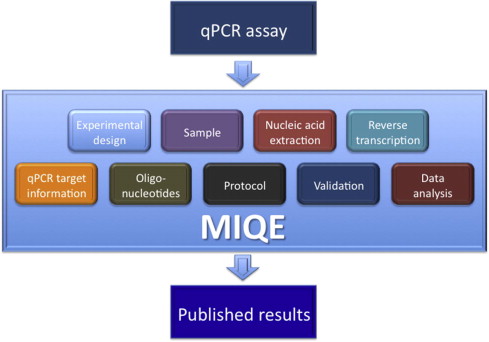
- Experimental design
- Extraction
- Reverse transcription
- Published results
This issue was partially solved by the publication of MIQE guidelines; however, there are differences in altitude to validation and standardization of PCR assays across clinical, veterinary and food safety areas. Any contribution to the unification of standardization and validation procedures will improve the quality of PCR assays in microbial detection, quantification and typing.